Proxmox Backup Verification – Part 2: How It Works
// Table of Contents
Disclaimer: This is an unofficial personal passion project, not an official Veeam product, and it isn’t supported or endorsed by Veeam in any way. I’m also not a professional developer, so treat this as a demonstration of the “art of the possible” rather than production-ready code, much of which was written with AI assistance. Use it with caution and test thoroughly in your own environment before relying on it for anything important.
Welcome back! In Part 1 I covered the why, and now I think it’s time we get into the tool and how it works. As I mentioned, I really love SureBackup and think it’s an epic piece of engineering that doesn’t get enough love, especially in today’s world where backup verification is key, which is why I started down this whole rabbit hole in the first place, so with that let’s get into it because this is where it really got fun.
What It Actually Does
Before we dive into the depths of the tech, I figured it would be worth giving a 10 thousand foot view of the app first.
If you have ever used SureBackup before this will seem very familiar, the tool takes a backup, restores it onto your cluster, and puts it on a network that looks exactly like your production network but is completely walled off from it. The recovered VM comes up thinking it’s the real thing, same IP address, same everything, but nothing it does can touch your actual production. The tool then runs a few checks inside the restored workloads, writes you a report you can hand to an auditor, and cleans the whole lot up afterwards. What’s different from SureBackup today is that we added in taking a screenshot of each workload to prove it’s booted successfully.
That’s it. See, told you it’s familiar, and super powerful because that verification is beyond awesome in my opinion, it takes it past just saying yes I have a good backup. Anyone can backup, but can you restore? That is the question.
How do we actually run this?
I made the decision to use the API for as much as possible where it allowed me to, both from a Veeam perspective and also Proxmox, I also made the decision to keep this a CLI tool because well I’m lazy and don’t like frontend work if I’m being honest. As a good friend of mine once said, long live the TUI.
The whole thing is one command line tool called pmx-lab. These are the commands you’d actually use day to day:
pmx-lab preflight                    # check what Veeam can and can't do today
pmx-lab app-group list-vms           # show every VM with a usable backup
pmx-lab app-group create <name>      # build a group from those VMs
pmx-lab publish <group>              # run the verification
pmx-lab status                       # how's it going
pmx-lab unpublish <run-id>           # tear the run back down
There’s a few more for managing the shared bits (gateway ensure, network teardown, runs list) but those six are the ones you’d type most days.
What’s Automated and What Isn’t
As I mentioned, not all of it could be automated. Taking a screenshot of the console had to be driven from within the host via qm monitor and then pulled back over SSH, and triggering the restore for Proxmox isn’t in the Veeam API yet either. Otherwise the process is fully automated including teardown, and a couple of steps were left manual on purpose.
| Step | Manual or automated |
|---|---|
| Backup inventory and eligible-VM detection | Automated |
| Application group creation (VM list, boot order, dependencies) | Automated |
| Isolated network provisioning | Automated |
| Gateway VM creation, routing, and NAT | Automated |
| Triggering the actual restore | Manual |
| Detecting the restored VM on Proxmox | Automated |
| Attaching the restored VM to its isolated network | Automated |
| Boot verification (console screenshot) | Automated (via SSH as root) |
| In-guest health checks | Automated |
| Report generation | Automated |
| Teardown of a single run | Automated |
| Decommissioning a shared isolated network | Manual, by design |
Locking Down Access
Because security is everyone’s role in an organisation I took the time to actually sit and work through the required permissions, which originally started out with one or two and eventually grew to a whole list, which took a few trial runs, debugging where it was failing and trying again.
Now I could have handed it a full admin token and called it a day, but that sort of thing always makes me a bit twitchy, so instead it gets a dedicated custom role with only the permissions it needs, granted straight to the token rather than to my user account.
That last bit matters more than it sounds, and it’s down to a lovely little Proxmox feature called token privilege separation. A token’s permissions are whatever you grant the token itself, not whatever its parent account can do. So even though my own admin account could quite happily go and wreck the entire cluster, the token this tool runs as can’t, it can only do the handful of things I’ve allowed it to. If it ever leaked, the blast radius is tiny.

Since the whole list was earned one 403 at a time, I figured it would be worth documenting the list and what they are used for, just so you get an idea of what was required.
| What it’s for | Privileges |
|---|---|
| Building and using the isolated networks | SDN.Allocate, SDN.Audit, SDN.Use |
| Creating and configuring the gateway VM | VM.Allocate, VM.Clone, VM.Config.Cloudinit, VM.Config.Disk, VM.Config.HWType, Datastore.AllocateSpace |
| Finding recovered VMs and attaching them to a network | VM.Audit, VM.Config.Network, VM.PowerMgmt |
| Running the in-guest health checks | VM.GuestAgent.Audit, VM.GuestAgent.Unrestricted |
| Node info and applying cluster level config | Sys.Audit, Sys.Modify |
Application Groups
Right, now moving onto the application groups, again if you have ever used SureBackup then this will make sense right away. Basically the app group is just a set of VMs that get spun up together in a particular order to do things, think Domain Controller, SQL Server and App Server.
App server needs the SQL server and the DC for authentication, DC needs to boot first then SQL then the app server so it all works, we also need to verify the DC is live and accepting queries otherwise the auth will fail, I’m sure you get the idea.
Building one is two commands. app-group list-vms goes off to Veeam and pulls back every VM that has at least one successful full backup, across every backup job you’ve got, so you can cherry-pick machines into a group even when they’re backed up by completely different jobs. Then app-group create walks you through the boot order and dependencies and saves it.
One thing worth mentioning. Veeam’s restore point network data for Proxmox currently gives back the network adapter’s ID and name, but not the IP address, subnet or gateway. Completely fair enough, it just means the app group config has a couple of fields you fill in yourself:
{
  "vm_name": "lab-dc-01-restored",
  "ip": "192.168.20.51",
  "mac": "bc:24:11:dd:61:42",
  "subnet_id": "labtest"
}
The mac field is there because Veeam’s restore assigns the recovered VM a fresh network adapter address, and plenty of guest operating systems pin their network config to a specific adapter. If that changes underneath them they’ll boot perfectly and come up with no network at all, which is a fun one to sit and puzzle over the first time. Because the group knows the original, the tool sets it back and the guest just carries on none the wiser.
The Isolated Network
Right, this is the heart of it. How do you boot a copy of your domain controller, on the same cluster as the real one, with the same IP address, without everything catching fire? And trust me, as a non-network engineer, things caught fire a few times whilst building this.
The answer is a completely separate virtual network that mirrors the production one. Proxmox has a feature called SDN (software defined networking) that does exactly this, and the first time the tool needs a given subnet it goes and builds one.
I went with the VXLAN zone type specifically. Proxmox gives you a few options here:
- A Simple zone only works on one node, no good on a three node cluster
- VLAN and QinQ zones need matching configuration on your physical switches, so now your backup verification tool has opinions about your switch config
- VXLAN gives you isolation across the whole cluster and needs nothing from the physical network at all
For something I just wanted to work without re-plumbing my lab, VXLAN was the obvious pick.
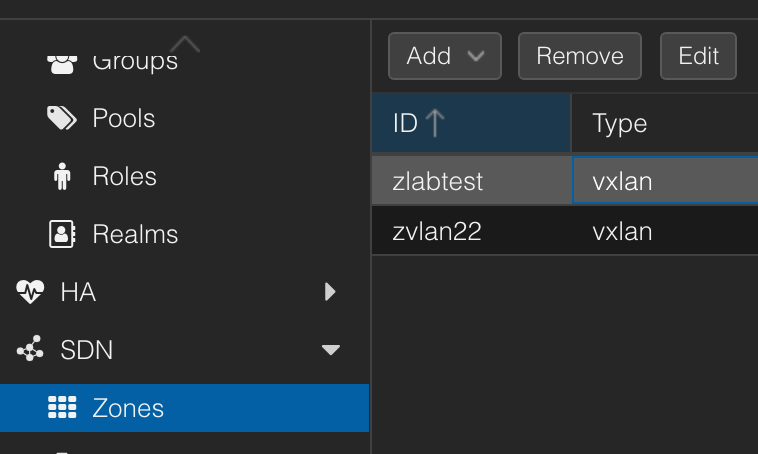
These networks are keyed to the production subnet, not to the application group. So if two groups both have VMs on your 192.168.20.0/24 network, they share the same isolated copy of it instead of each building their own. Build it once, reuse it forever.
The Gateway VM
An isolated network solves the safety problem beautifully, but it creates two new ones.
First, you can’t get to anything inside it. The recovered VM has your real production IP, so you can’t just browse to it, the real machine is already sitting on that address.
Second, a multi-tier application is spread across more than one subnet, and each of those subnets is its own sealed box. Your app server on one network can’t see the domain controller on the other.
Both of those get solved by one small VM that sits in the middle. It gets built once, automatically, the first time it’s needed, and it picks up a connection to each isolated network as those networks come into existence. It does two jobs:
Production subnet(s)
       |
       | (mirrored into an isolated copy)
       v
Isolated VXLAN networks   <---- one per subnet, reused by every group
       |
       v
  Gateway VM  ----  routes between the isolated networks
       |       \___ maps a reachable address to each recovered VM
       v
Your management network
The routing job means a multi-tier group works properly, your app server can talk to your DC exactly as it would in production.
The address mapping job is how you get in. Each recovered VM gets given a second, separate address on the gateway that you can reach from your normal network. So the recovered domain controller keeps its real 192.168.20.51 on the inside, and you reach it on something like 172.30.45.51 from your desk. No conflict, no touching production, and you can log in and poke around a recovered machine while it’s running.
That second address is what I’ll call the masquerade IP from here on, it’s just plain old NAT under the hood, the gateway quietly translating between the address you can reach and the real one the VM thinks it has. Worth knowing the term because you’ll see it on the report and in Part 3 and also within Veeam documentation when checking out how SureBackup works.
Why the Gateway Lives on Its Own VLAN
There’s one more piece to this that took me a while to get right, and it’s the difference between “sort of isolated” and actually matching what SureBackup does.
A recovered VM keeps its real default gateway address, say 192.168.20.1. The whole point of that is because we don’t want to change anything to run a test, a test where you’ve gone and reconfigured the machine first isn’t really a test of anything. But it means that for that VM to reach anything at all beyond its own subnet, something inside the isolated network has to actually answer as 192.168.20.1. Veeam’s proxy appliance does exactly this on the VMware side, it impersonates the real gateway on each isolated network it serves.
My gateway VM couldn’t do that while its own management address lived on that same production subnet, because then you’ve got a machine claiming to be 192.168.20.1 with one foot in the isolated copy and one foot in the real network. One misbehaving network announcement away from impersonating the real router on production. This is just because of my lazy network design when I started my homelab, again not a network engineer, but the unknown benefit here was that it actually forced me to fix something in my lab I’ve been putting off for ages.
The fix was to give the gateway its own dedicated VLAN, completely separate from every subnet it isolates. With its real presence off those subnets entirely, it can safely claim each one’s gateway address on the isolated side with nothing able to leak back.
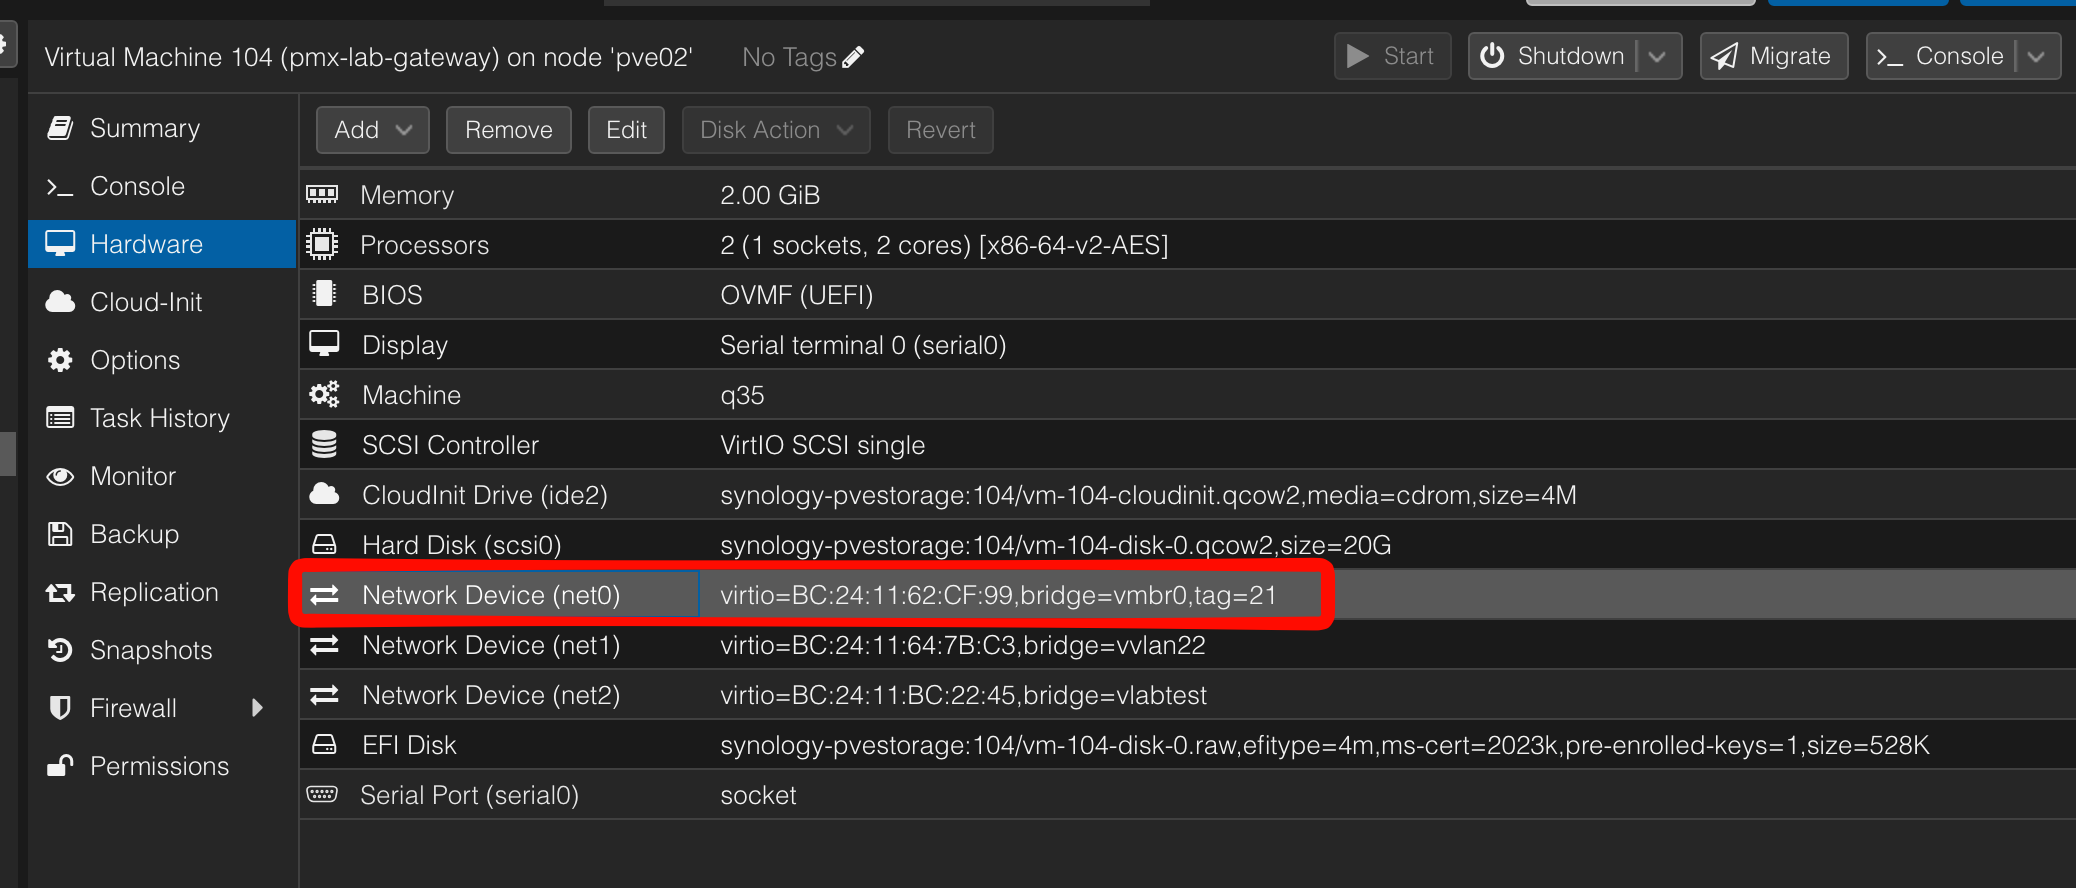
The configuration, the network connections, the address mapping, even the patching, all of it goes through the Proxmox API and the guest agent. If it ever gets itself into a weird state the answer isn’t to log in and start poking at it, it’s pmx-lab gateway rebuild, which throws it away and builds a fresh one from a known-good template. The caveat here of course was pre-creating the Ubuntu template, which took me some time to get working with Packer, and that was a whole other side quest for another time.
Proving It Booted
Taking some inspiration from a fellow V100 member, Ben Harmer, I decided to add in the option to take a screenshot of the workload to make sure it’s actually booted up, such a simple idea but so effective.
The idea is simple, grab a screenshot of the VM’s console, the same thing you’d see if you opened it in the web UI. Doing it turned out to be the one part of this project that fought me hardest on the API-first rule, and it’s the reason that whole section exists.
Proxmox flat out refuses the screendump command for any API token, no matter what permissions you give it. I burned a fair bit of time on that one assuming I’d just missed a privilege somewhere, but it turns out the check is looking for the literal root@pam user, and a token can never present itself as that no matter who created it. So there’s no permission you can add that fixes it. Happy to be proven wrong here but I could not get it working.
The answer was to run it as the actual root user over SSH instead, and then pull the image file back over SFTP, which Proxmox has no API for either. So this is the one spot where both halves of the job fall outside the API. Annoying, but well worth it in my opinion as this proves the machine is up and running visually, being able to see the login screen makes all the difference I reckon.
And here it is, the whole reason this project exists, a domain controller that came out of a backup a few minutes earlier sat at its login prompt:
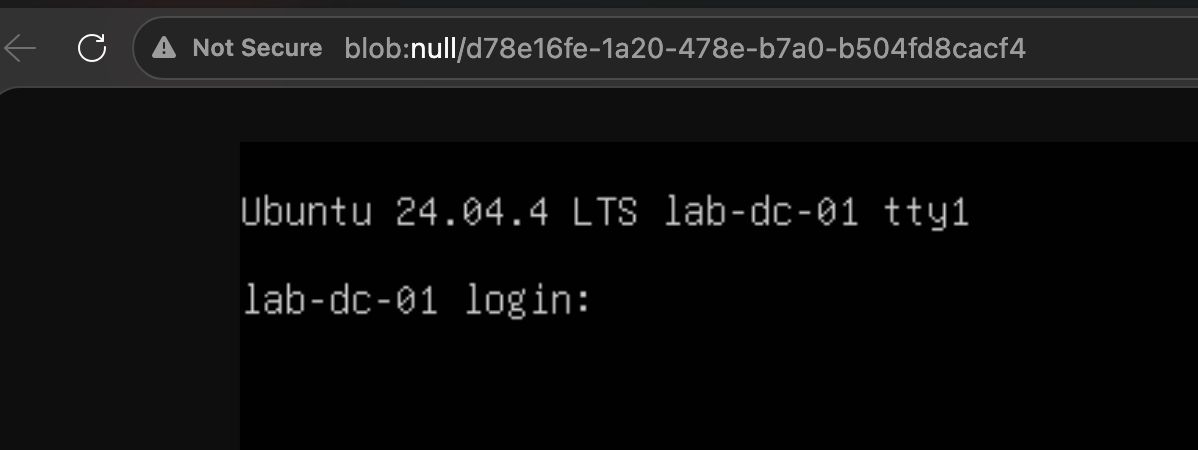
That’s not a green tick telling you a job finished successfully, that’s the machine itself.
Shout out to Ben for the awesome idea, love it and please go check out his blogs as well!
Beyond the Screenshot
A screenshot proves the machine booted, but it can’t tell you whether anything inside it is actually healthy. A VM can sit at a perfectly good login prompt while the service you care about crashed on startup or a disk never mounted.
SureBackup solved this years ago by layering a few extra tests on top of the boot, so I did the same thing. There are two kinds:
A ping test, fired from the gateway at the recovered VM. Needs absolutely nothing running inside the guest, which matters, because I can’t promise every machine I’d want to verify has an agent installed and behaving.
Named health checks, which are small scripts that run inside the guest through the Proxmox guest agent. Each one lives in the repo as a Linux version and a Windows version:
scripts/health/system-running/linux.sh
scripts/health/system-running/windows.ps1
scripts/health/ad-connectivity/linux.sh
scripts/health/ad-connectivity/windows.ps1
You just name the ones you want on each VM in the group:
{
  "vm_name": "lab-app-01-restored",
  "health_checks": ["system-running", "ad-connectivity"]
}
The tool asks the guest what operating system it’s running, picks the matching script, copies it over, runs it, and tidies up after itself. The script’s exit code determines whether it was a success or a failure, zero means healthy and anything else means it isn’t, same convention as every other health check tool going.
system-running is the general one, it checks whether the operating system reckons everything came up cleanly. ad-connectivity is the more interesting one, it checks that a machine can actually reach a domain controller’s DNS, Kerberos, LDAP and SMB ports. That one’s deliberately built with no dependencies at all, no installing packages onto the guest first, because a health check that needs internet access to run isn’t much use inside an isolated network.
Putting It All Together
That’s a lot of moving parts across a lot of sections, so here’s the whole thing in one picture, a two tier app group with a domain controller and an app server:
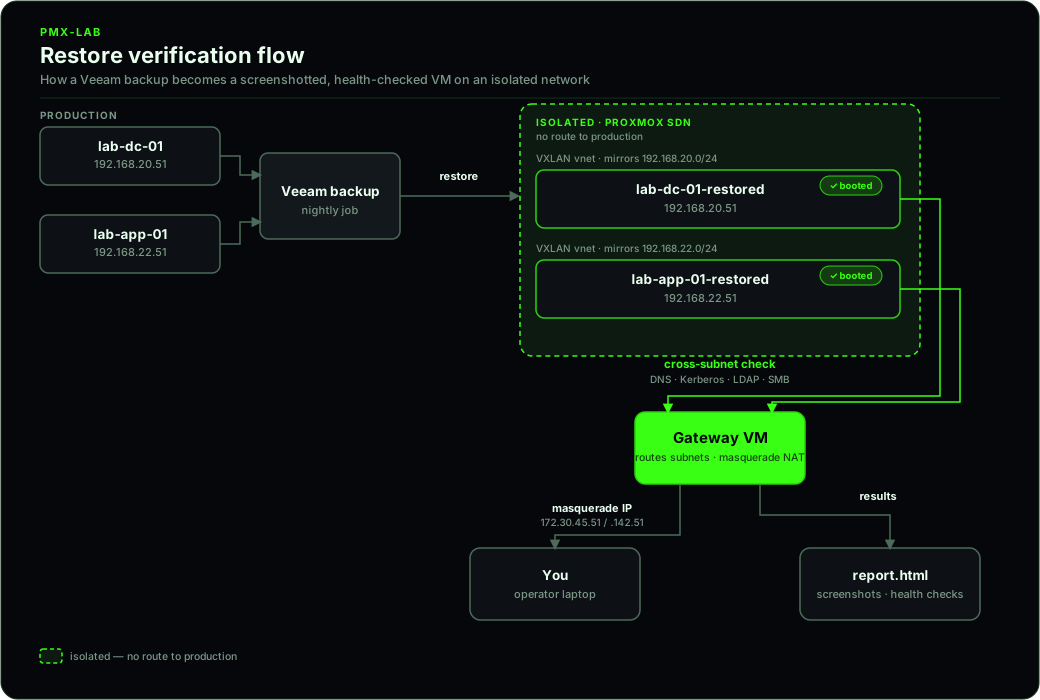
Both VMs get restored from the same Veeam backup server onto the isolated network, still on their real IPs. The gateway hands you a masquerade IP for each one so you can get in from your desk, and it’s also what lets lab-app-01-restored reach lab-dc-01-restored for the AD connectivity check even though they’re sat on two different isolated subnets. Every check, screenshot included, feeds into the one report at the end.
Cleaning Up
When you’re done, unpublish removes the recovered VMs and their address mappings. The isolated networks and the gateway VM stay exactly where they are, because they’re shared infrastructure the next run will want.
You can run it whenever you like, or set an auto-unpublish timeout when you publish so it tidies up on its own if you wander off and forget, which for me is most of the time if I’m honest.
Retiring an isolated network for good is its own separate command, and it refuses to run if any application group still references that subnet. Like I said earlier, that one stays manual on purpose.
What’s Next
That’s the how. In Part 3 I’m running the whole thing live on my real three node cluster, against a real Veeam backup server, with a full multi-tier application group, a domain controller and an app server sitting on two different subnets, talking to each other exactly the way they would in production. Manual step and all, with a video so you can watch it happen rather than take my word for it.
Thanks for reading, see you in Part 3.